
The Marker Service API is a RESTful interface to the various Area Monitoring markers. This article describes the structure of the marker data it returns, so you can interpret responses for each marker type.
Fields common to every marker
Every marker response includes:
| Key | Description |
|---|---|
id |
Marker ID |
markerTypeId |
Marker type ID |
inferenceId |
Inference ID |
foiId |
FOI (feature of interest) ID |
status |
OK, NOT_VALID, or NOT_EXECUTED
|
Most markers also carry impl, the marker class — for example OBSERVATION, EVENT, CLASSIFICATION, AGGREGATION, or EVENT_COMPOSITE.
Observation markers
Bare-soil marker
Returns observationCount (count of all the FOI's bare-soil observations) and markerObservations, a list where each entry has a date (signal acquisition date) and a confidence between 0 and 1 that the observation is bare soil.
Event markers
Ploughing marker
Returns an events list. Each event describes a detected rise in bare-soil pseudo-probability (BS_PROBA): start (date before a significant rise was detected), startThreshold (first date the rise was detected), extrema (timestamp of the highest BS_PROBA in the interval), end (end of the ploughing period, same as extrema), endThreshold, the BS_PROBA values at each of those dates (startValue, startThresholdValue, endThresholdValue, extremaValue, endValue), and numObservations (valid observations within the interval).
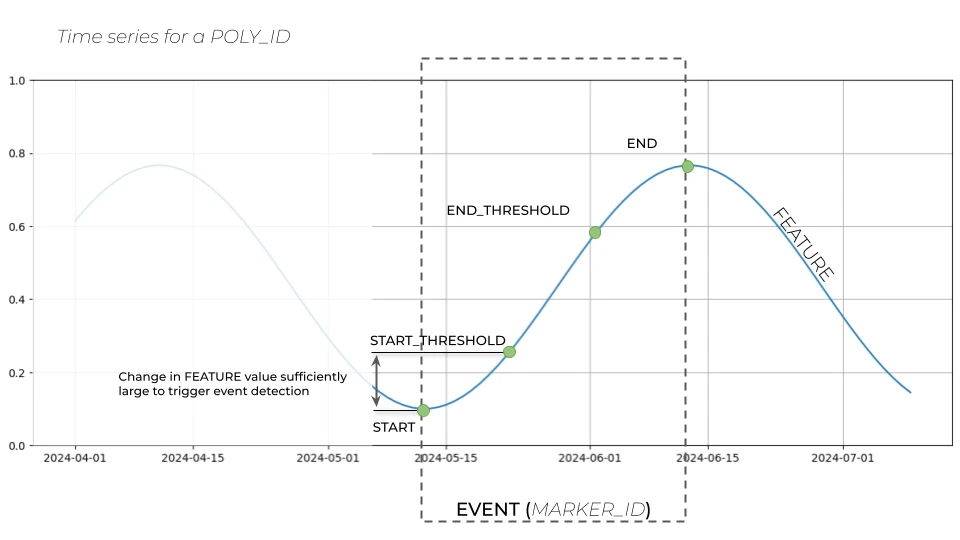
Anatomy of a rise event: how start, startThreshold, endThreshold, extrema, and end relate to the BS_PROBA curve.
Mowing marker (FOI level)
Returns an events list describing detected NDVI drops: start (last date before the drop), startThreshold (first date the significant drop was detected), extrema (timestamp of the lowest NDVI in the interval), end (first date after extrema when NDVI recovered sufficiently), endThreshold, the NDVI values at each date, numObservations, and a probability of the event.
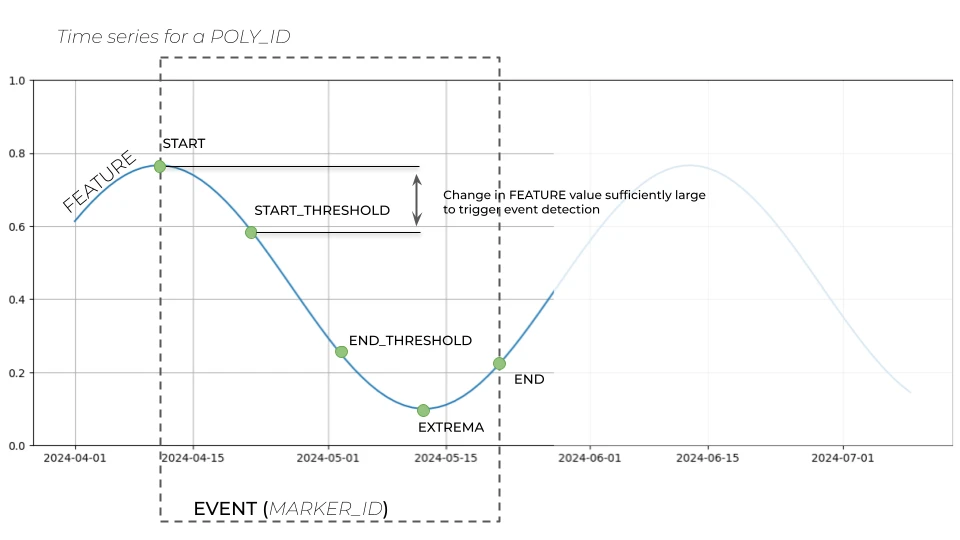
Anatomy of a mowing event: how the event fields relate to the NDVI drop and recovery.
Pixel-mowing marker
Detects partial mowing at the pixel level. Each event includes NDVI bookkeeping (ndviStart, ndviThreshold, ndviBottom, ndviEnd, ndviDrop), the event dates (eventStart, eventThreshold, eventEnd, bottomTimestamp), daysBetweenStartAndThreshold, duration, numObservations, and an eventMask — a boolean raster mask describing which pixels belong to a cluster.
Pixel-mowing aggregation marker
Aggregates pixel-mowing results per FOI: mowingDetected (flag set when mowing was detected according to the specified query), coverageSizePix (count of all pixels with a detected event), coverageRatio, maxChunkSizePix and maxChunkRatio (size and relative coverage of the largest affected part of the FOI), numPixels (source pixels inside the FOI geometry), and data — a pixel mask of mowing event counts.
Greening-harvest marker
Returns eventComposites, a list of rise–fall pairs. The rise object describes the greening period (a significant NDVI rise): start, startThreshold, endThreshold, extrema (highest NDVI), end (same as extrema), the NDVI values at each date, and numObservations. The fall object describes the harvest period (a significant NDVI drop) with the same field structure, where extrema is the lowest NDVI.
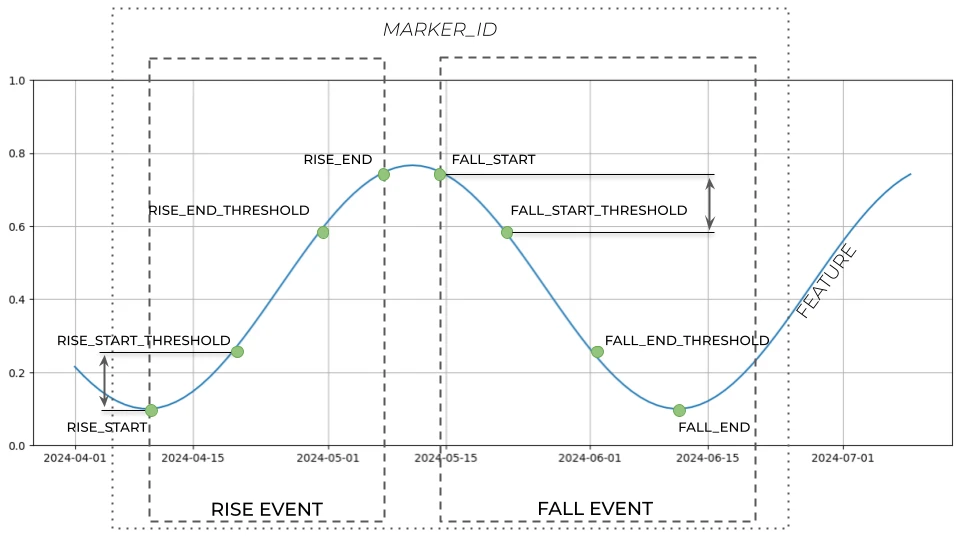
Anatomy of a rise–fall pair: the greening period (rise) followed by the harvest period (fall) on the NDVI curve.
Classification markers
These markers score hypotheses and share a common shape: classificationCode(the hypothesis with the highest score or confidence, or for the similarity and Euclidean distance markers, the most similar crop type), classificationScore (its score, 0–100), and markerScores — a list of { hypothesisCode, score } entries.
Homogeneity marker
Hypotheses are homogeneous and heterogeneous; score is the normalised (0–100) probability of the hypothesis being true.
Similarity marker
Also returns declaredAsCode (the declared crop type). hypothesisCode is an assumed crop type based on neighboring FOIs, and score is the normalised (0–100) representation of the chi-squared value of the NDVI time-series difference between the target FOI and its neighbors — the lower the score, the more similar.
Euclidean distance marker
Same shape as the similarity marker, where score is the normalised (0–100) representation of the median Euclidean distance between the NDVI time series of the target FOI and neighboring FOIs that have the assumed crop type declared (again, lower = more similar). Also returns sameCropCount — the number of neighboring FOIs with the same declared crop type as the target.
Crop-group marker
classificationCode is the assumed crop group with the highest confidence (for example, POTATOES), declaredAsCode is the declared crop group (mapped from the declared crop type), and each markerScores entry gives the confidence (0–100) in an assumed crop group.
Land-group marker
Identical structure to the crop-group marker, with land-use groups (for example, ARABLE LAND, GRASSLAND (PERMANENT PASTURE), GREENHOUSE, PERMANENT CROPS) as hypotheses.
Aggregation and evaluation markers
Mean-NDVI marker
Returns a single value: the mean NDVI of all valid observations for the FOI.
Count aggregation
Returns count — the number of valid occurrences according to a given condition (for example, the number of valid observations, or the number of observations where the FOI's mean NDVI was above a threshold).
Evaluation
Returns evaluation — true/false result of evaluating the given condition(s).
Learn more
- Marker Service API in the Planet docs, including full example responses for every marker type

Comments
Article is closed for comments.